MLA -- collaborative filtering
"Collaborative filtering can be divided into users or items filtering. With its excellent speed and robustness, collaborative filtering is hot in the global Internet field. 😃😃"
[toc]
In general speaking, Collaborative Filtering is to use some behavior information from a group of people who has similar interests and common experience to recommend new information that one user in the group may be interested in. Individuals give a response to the information (such as scoring) through the cooperative mechanism and record it to acheive the purpose of filtering and then help others to filter the information.
Collaborative filtering can be divided into users or items filtering. With its excellent speed and robustness, collaborative filtering is hot in the global Internet field. 😃😃
I. User-Based CF
The user-based collaborative filtering algorithm is to discover the user's preference of the product or content based on the user's historical behavior data (such as product purchase, collection, content review or sharing), and measure or score to quantize these preferences.
According to the attitudes and preferences of different users towards the same product or content, the relationship between users can be calculated. Then we can recommend products or contents among users with similar preference.
To be simiply, if user A and user B all purchased books "x", "y" and "z", and also all gave them 5 stars comments. Then user A and user B should belong to a same group. And the book "w" that user A read and like could be recommended to the user B. (This is the benifit of user-based CF.)
1. Find users with similar preferences
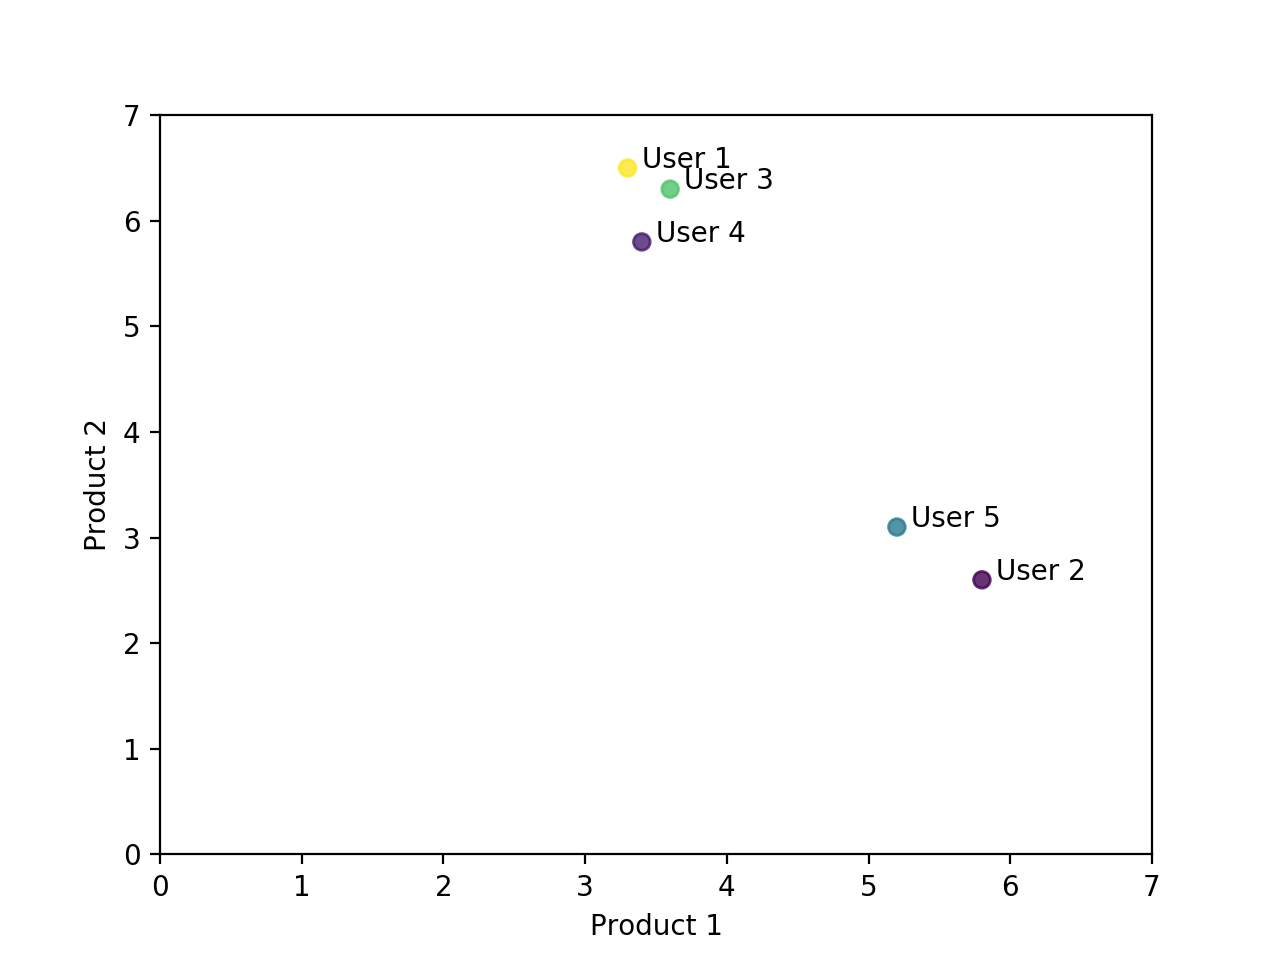
Let's simulate a situation that 5 users score 2 products. The score here may indicate a real purchase, or it may be a quantitative indicator of the user's different behaviors of the product. For example, the number of times you browse products, recommend products to friends, bookmark, share, or comment. These behaviors can indicate the user's attitude and preference to the product.
| Product 1 | Product 2 | |
|---|---|---|
| User 1 | 3.3 | 6.5 |
| User 2 | 5.8 | 2.6 |
| User 3 | 3.6 | 6.3 |
| User 4 | 3.4 | 5.8 |
| User 5 | 5.2 | 3.1 |
From the data in the table above, it is a bit hard to figure out the relationship among these five users. However, if we plot all these five points in a scatter chart, the conclusion is obvious. User 1, 3 and 4 is one group, and User 2 and 5 is another group.

# Python code for drawing the scatter plot above
import matplotlib.pyplot as plt
import numpy as np

x = [3.3, 5.8, 3.6, 3.4, 5.2]
y = [6.5, 2.6, 6.3, 5.8, 3.1]
colors = np.random.rand(5)

plt.scatter(x,y,c=colors,alpha=0.8)
plt.xlim(0,7); plt.xlabel("Product 1")
plt.ylim(0,7); plt.ylabel("Product 2")

for i in range(5):
	plt.annotate("User "+str(i+1), xy=(x[i],y[i]),  xytext = (x[i]+0.1, y[i]+0.0))  # 这里xy是需要标记的坐标,xytext是对应的标签坐标

plt.show()
2. Similarity Calculation
Although the scatter plot is intuitive, it cannot be put into production. Therefore, we need to accurately measure the relationship of users through real numbers, and complete the recommendation of products based on these relationship conclusions.
2.1. Euclidean distance evaluation
Euclidean distance is a relatively simple method to evaluate the relationship among users. The principle is to calculate the distance of each two points in the scatter chart.
| Distance | Reciprocal | |
|---|---|---|
| User 1 & 2 | 4.63 | 0.22 |
| User 1 & 3 | 0.36 | 2.77 |
| User 1 & 4 | 0.71 | 1.41 |
| User 1 & 5 | 3.89 | 0.26 |
| User 2 & 3 | 4.30 | 0.23 |
| User 2 & 4 | 4.00 | 0.25 |
| User 2 & 5 | 0.78 | 1.28 |
| User 3 & 4 | 0.54 | 1.86 |
| User 3 & 5 | 3.58 | 0.28 |
| User 4 & 5 | 3.24 | 0.31 |
From the calculation above, if we defined a threshold, we can easily cluster these users.
2.2. Pearson correlation evaluation
Pearson correlation evaluation is another method to calculate the relationship between users. It is a bit more complicated than the calculation of Euclidean distance, but Pearson correlation evaluation can give a better result when the score data is not standardized.
The formula of Pearson correlation coefficient between variable x and y is:
and are the mean value of variable x and variable y.
is tne overall correlation coefficient.
If we estimate the covariance and standard deviation of the sample, we can also get the sample's Pearson correlation coefficient "r".
is the standard score (Z) of sample variable X.
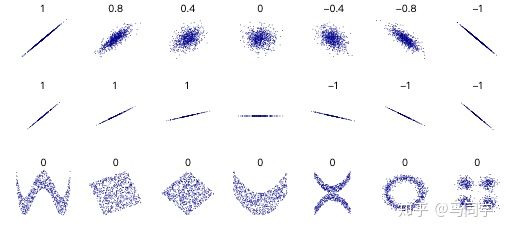
The Pearson correlation coefficient always falls in -1 and 1. The Pearson coefficient is symmetrical: corr(X,Y) = corr(Y,X).

An important mathematical characteristic of the Pearson correlation coefficient is that any change of the position and scale of the two variables will not cause the change of the coefficient. That is, if we move X to a+bX, and move Y to c+dY, (a,b,c,d are all constants), the correlation coefficient of X and Y doesn't change.
Therefore, the Pearson correlation coefficient can be also writen as:
And the sample's correlation coefficient is:
Suppose X and Y are the variables that represents various rating data to a same set of products from User X and User Y. As we all know, different users has different attitudes, someone is conservative and someone is aggresive to their rating. A good thing of Pearson correlation coefficient is that it could remove these difference and standardize variable X and Y. And the coefficient measures how does Y change when X increase? increase or decrease? Exactly the same change means 1, and completely opposite change means -1.
Give a example, which is closer to the real case.
| Product 1 | Product 2 | Product 3 | Product 4 | Product 5 | |
|---|---|---|---|---|---|
| User A | 3.3 | 6.5 | 2.8 | 3.4 | 5.5 |
| User B | 3.5 | 5.8 | 3.1 | 3.6 | 5.1 |
| User C | 5.6 | 3.3 | 4.5 | 5.2 | 3.2 |
| User D | 5.4 | 2.8 | 4.1 | 4.9 | 2.8 |
| User E | 5.2 | 3.1 | 4.7 | 5.3 | 3.1 |
We calculated the similarity data between users by calculating the ratings of 5 products by 5 users above. Here you can see that users A&B, C&D, C&E and D&E have a high similarity. Next, we can recommend products to users based on similarity.
| Similarity | |
|---|---|
| User A&B | 0.9998 |
| User A&C | -0.8478 |
| User A&D | -0.8418 |
| User A&E | -0.9152 |
| User B&C | -0.8417 |
| User B&D | -0.8353 |
| User B&E | -0.9100 |
| User C&D | 0.9990 |
| User C&E | 0.9763 |
| User D&E | 0.9698 |
3. Recommend products for users
Continue the above example, if we want to recommend some new products to User C. We can find out the most similar user of him or her at first, that is, user D at above table. Then we can browse and screen out those products that User D likes but User C doesn't try before, and then recomemnd to User C. This is a very intuitive way, however, in real case, there might be some more complicated calculation to weight and sort these new products, then choose the best one product to recommend. For example, find out 2 or 3 most similar users and combine their rating records to weight new products to recommend.
4. Pros and cons of the Algorithm
- Data sparsity. A large-scale e-commerce recommendation system usually has a lot of items, and users may buy less than 1% of the items. The overlap of items bought by different users is low, resulting in the algorithm unable to find a user's neighbors, that is, similar preferences Users.
- Algorithm scalability. The calculation amount of the nearest neighbor algorithm increases with the increase of the number of users and items, and is not suitable for use in a large amount of data.
5. Code Example (Python)
Dataset Example: There are 138493 users' records of rating to the different movies they have watched. Try to use User-Based CF Algorithm to recommend movies to any user.
| userId | movieId | rating |
|---|---|---|
| 1 | 2 | 3.5 |
| 1 | 29 | 3.5 |
| 1 | 32 | 3.5 |
| 1 | 47 | 3.5 |
| 1 | 50 | 3.5 |
| ... | ... | ... |
| 138493 | 68319 | 4.5 |
| 138493 | 68954 | 4.5 |
| 138493 | 69526 | 4.5 |
| 138493 | 69644 | 3.0 |
| 138493 | 70286 | 5.0 |
| 138493 | 71619 | 2.5 |
Solution:
https://github.com/ZL-Wu/python-code-pool/blob/master/collaborative_filtering.ipynb
II. Item-Based CF
Item-Based CF's principle is basically the same as that of User-Based CF. In User-Based CF, consider the User as Item, and Item as User. According to the various rating data from various users to several product, we can calculate the similarity between each two products. Then for each user, this algorithm can recommend new and most similar product based on those products he or she used before.
1. Advantages
- Can filter information that the machine is difficult to analyze automatically, such as artwork, music, etc.
- Share the experience of others, avoid incomplete or inaccurate content analysis, and can filter based on some complex and difficult to express concepts (such as information quality, personal taste).
- The ability to recommend new information. It can be found that the content is completely dissimilar, and the content of the recommended information is not expected by the user in advance. You can discover the user's potential interest preferences that you have not yet discovered.
- Recommend personalization and high degree of automation. Can effectively use the feedback information of other similar users. Accelerate the speed of personalized learning.
2. Disadvantages
- New User Problem (New User Problem) The quality of the recommendation at the beginning of the system is poor.
- New Item Problem The quality depends on the historical data set.
- Sparsity
- System scalability (Scalability).
III. Conclusion
According to the different data source, Recommendation Engines can be can be divided into three categories:
- Demographic-based Recommendation
- Content-based Recommendation
- Collaborative Filtering-based Recommendation
(IBM's introduction of recommendation engines)
Content-based Recommendation is based on the metadata of item or content to find the relation among them. For example, we define various feature of movies, such as category, length and so on, then build a model to group similar movies. Finally, recommend users new movies by looking for similar movies of the user's favorite movies.
Collaborative Filtering-based Recommendation can also be divided into three categories:
- User-based CF: User A likes Items 1,2,3. User C likes Items 1,2. And User A and User C are similar. Therefore, recommend Item 3 to User C.
- Item-based CF: User A likes Items 1,2,3. User C likes Item 1,2. And Item 1 and Item 3 are similar. Therefore, recommend Item3 to User C.
- Model-based CF: Based on the sample user preference information, train a recommendation model, and then make prediction recommendations based on real-time user preference information.
Content-based Recommendation needs to know the contents and details of items or products.
However, CF Recommendation is totally a statistical model. We don't need to know the details about the product and the content. What we did is only research user's behavior.
IV. Reference
https://www.zhihu.com/question/19971859
https://www.jianshu.com/p/d15ba37755d1
https://baike.baidu.com/item/协同过滤/4732213?fr=aladdin
https://wiki.mbalib.com/wiki/长尾理论
https://baike.baidu.com/item/皮尔逊相关系数/12712835?fr=aladdin
https://baike.baidu.com/item/协方差